
Short answer: Yes, but far less than its backtest suggests. Golden BREAK is a genuine multi-strategy gold breakout EA with a hard stop on every trade, and the author's real-money signal is in profit (profit factor 1.45). Our backtest turned 1,000 USD into 17.7 million USD with a profit factor of 4.73. That number is an artefact of compounding and of the tester model, and we explain exactly why below. Expect results closer to the live signal.
We approached this like an investigation: what the author publishes, what the live signal shows, what users report, and then our own backtest of the free MT5 demo, with every claim checked against the data.
Golden BREAK at a glance
| Platform | MetaTrader 5 |
| Developer | Sakon Muangpakdee |
| Version tested | 5.3 |
| Market | XAUUSD only, attached to H1 (sub-strategies read M5, M15, H4) |
| Strategies | 7 breakout sub-strategies: GB1–GB6 and GB8 (no GB7) |
| Default portfolio | Run All Strategies (InpPortfolio = 6) |
| Risk model | Hard SL per trade, 1% risk per trade (InpLotMode = 1), compounding |
| Grid / martingale | None |
| Price at time of test | 199 USD, or 49 USD/month to rent |
| User rating | 4.82 from 11 reviews |
1. What the author publishes
- Breakouts around swing highs and lows with pending orders, a hard SL on every trade, and separate TP and trailing per strategy.
- "No grid. No martingale."
- Portfolios: Conservative (GB1–GB4), Scalping (GB5, GB6, GB8), Run All, or Custom. Run All is the default.
- Lot by fixed size or risk per trade; risk is per trade, so running several strategies adds up.
- Optional Cluster Risk Protection, Basket Profit Protection and an MQL5 Calendar news filter, all off by default.
- No public set files; minimum deposit and leverage are not stated.
2. What the live signal shows
| Metric | Author's live signal (VT Markets, real) |
|---|---|
| Growth | +171.47% |
| Trades | 421 |
| Win rate | 68.64% |
| Profit factor | 1.45 |
| Max balance drawdown | 32.07% |
| Equity drawdown | 7.18% |
The growth figure is calculated the MQL5 way, which adjusts for deposits. In money terms the account started with 100 USD, received another 400 USD and had made about 300 USD of profit at the 20-week mark. Monthly results included +69.86% in June, −15.88% in July and +11.3% in September: profitable, but uneven.
3. What users report
- Praised: steady profits, fast support, frequent updates, the GB6 "precision scalp" strategy; one user says live results match the backtest.
- Criticised: drawdown periods, results below expectation for one user, broker issues early on, many false breakouts in April–May, and a version (2.20) that had to be rolled back.
- Common questions: requests for set files, max spread, a false-breakout filter and lot sizing for small or cent accounts.
- Update history: about 20 versions in 7 months (1.40 to 5.3), with the core logic rebuilt more than once, so results differ between versions.
4. Our backtest: key numbers
Test conditions: XAUUSD H1, 18 Nov 2025 to 18 Nov 2026, 1,000 USD deposit, demo default inputs (Run All, 1% risk per trade, compounding), model "1 minute OHLC", IC Markets demo data.
| Metric | 12-month backtest | Latest month (15 Oct–15 Nov 2026, fresh 1,000 USD) |
|---|---|---|
| Net profit | +17,685,964.99 USD | +471.28 USD |
| Profit factor | 4.73 | 2.35 |
| Trades | 1,650 | 143 |
| Win rate | 78.67% | – |
| Drawdown | 8.99% max equity, 15.54% relative | 6.89% |
5. Why +17.7 million USD is the wrong number
- Compounding plus a lot cap. Position size grew from 0.03 lots in November 2025 to 2.36 lots by April 2026 and hit the 100-lot cap on 16 July 2026. After that, 468 trades opened at 100 lots. That is a compounding curve, not a plan.
- Trailing stops inside simulated minutes. The tester creates four ticks per minute; all 3,300 deals sit on second :00, :20, :40 or :59. Of the 1,139 trades that closed on their stop in profit, 656 closed at second :59 of the same minute they opened. The tester assumes price touched the high and then the close, so a tight trailing stop "locks" a win that real ticks may not give.
- The live gap confirms it. Backtest profit factor 4.73 versus live 1.45, backtest win rate 78.67% versus live 68.64%.
6. How the seven strategies trade
| Strategy | Trades | Stop loss (gold price) | Take profit | Main exit |
|---|---|---|---|---|
| GB5 | 481 | 5.00 USD | 30.00 USD (6R) | Tight trailing |
| GB6 | 433 | 3.00 USD | 15.00 USD (5R) | Tight trailing |
| GB8 | 352 | 3.00 USD | 12.00 USD (4R) | Tight trailing |
| GB2, GB3, GB4 | 98, 98, 130 | 15.00 USD | about 1R | TP, break-even or early close |
| GB1 | 58 | 15.00 USD | about 8.5R | Distant swing target |
- Entries: buy stop and sell stop at swing levels, both sides at once, pending for days. GB8 sits 0.50 USD closer to price than GB5/GB6, so it usually fills first on the same breakout.
- Exits: only 164 trades closed at TP; most exits are trailing stops. 71 trades closed at exactly the entry price (break-even), and some GB2–GB4 trades close early when price returns to the breakout level.
- Sizing: lot = risk % ÷ stop distance on min(balance, equity). On 1,000 USD the 0.01 minimum lot already risks 1.5% on GB1–GB4 (15 USD stop).
- No martingale, no grid: lot never rose after a loss. But it can re-enter the same price after a stop-out, and one strategy can hold several trades at the same price at once.
7. When it trades
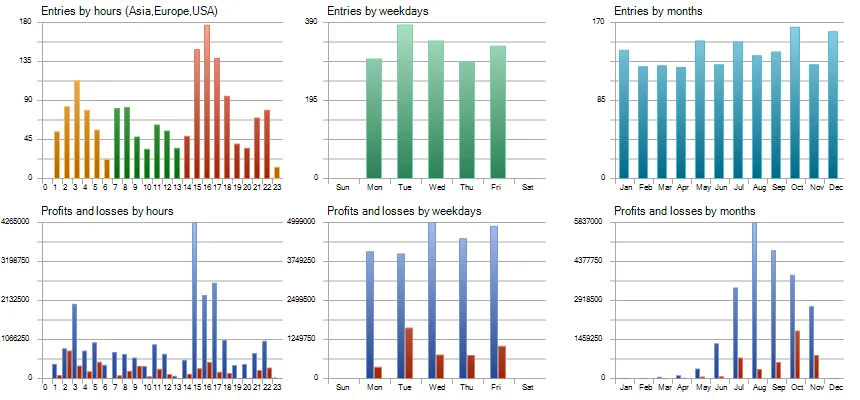
- Busiest window: 16:00–19:59 server time, 27% of all entries.
- No entries between 00:00 and 01:01; GB6 never traded between 22:15 and 01:15, matching its time block.
- Balanced direction: 820 buys (80.24% won) and 830 sells (77.11% won).
8. Risk: what the drawdown figure hides
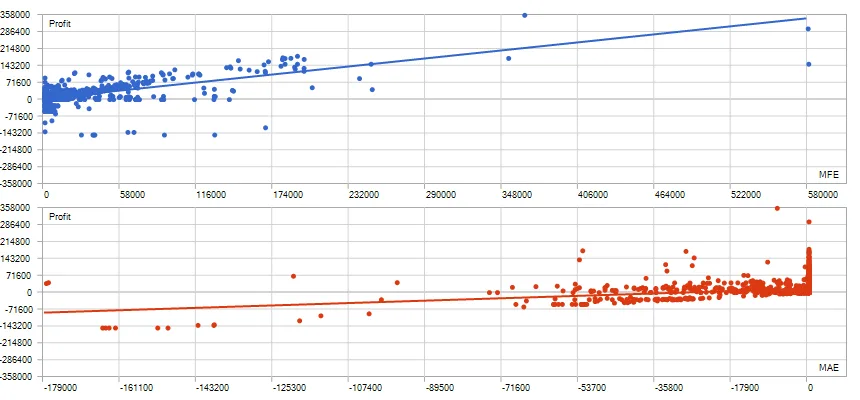
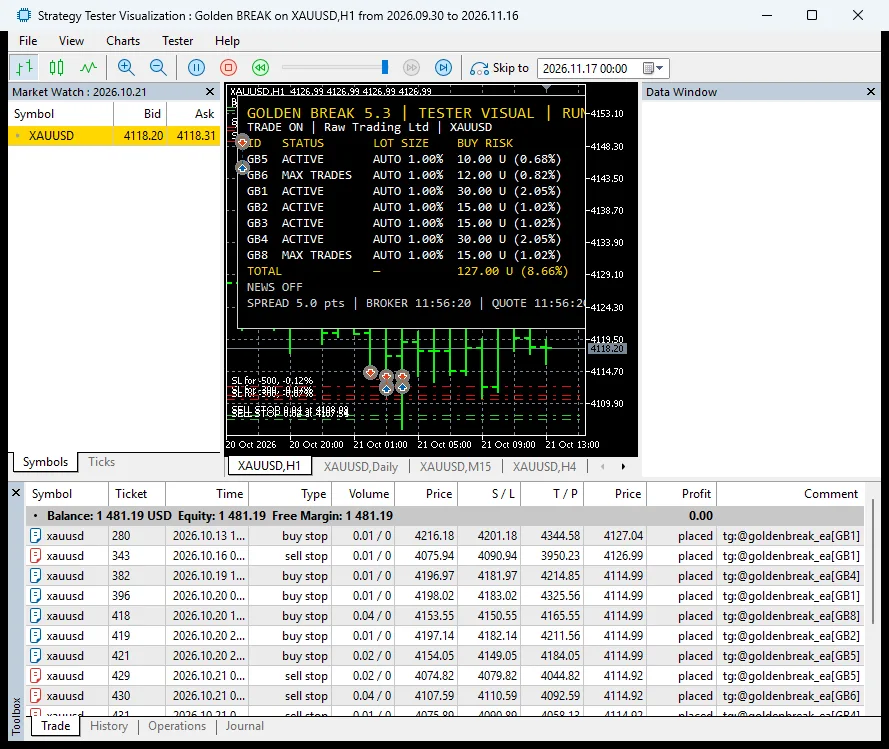
Each trade risks 1%, but the strategies stack: the dashboard showed up to 8.66% of the balance at risk on one side at once. The live account shows the real-world result of that stacking: a −15.88% month and a 32.07% maximum balance drawdown, while the backtest equity drawdown stayed under 9%.
9. Settings that change the result (one-month test)
| Setting | Net profit | Profit factor | Drawdown |
|---|---|---|---|
| Default (1% risk) | +471.28 USD | 2.35 | 6.89% |
InpRiskPerTradePercent = 0.5 | +153.89 USD | 1.74 | – |
InpRiskPerTradePercent = 2 | +1,351.30 USD | 2.69 | 7.35% |
InpBasketEnabled = true | +523.02 USD | 2.59 | 5.08% |
InpOffTradeDay = 1 | +523.99 USD | 3.00 | – |
InpClusterMaxRiskPercent = 0.5 | No trades: the cap is below the risk of a single trade | ||
Basket Profit Protection (needs a hedging account) was the only change that raised profit and lowered drawdown in our test month. One month is a short window, so treat these as directions, not settings to copy blindly.
10. Claims versus what we found
| Claim | Our finding | Status |
|---|---|---|
| No grid, no martingale | No lot increase after losses, no price-step grid | Confirmed (re-entries at the same price happen) |
| Hard SL on every trade | 100% of trades: 3, 5 or 15 USD by strategy | Confirmed |
| Run All is the default | Dashboard shows "RUN ALL STRATEGIES", all 7 trade | Confirmed |
| Risk adds up across strategies | Up to 8.66% one-sided risk at once | Confirmed, higher than many users expect |
| GB6 blocked 22:15–01:15 | 0 GB6 trades in that window | Confirmed |
| Live results match the backtest (user claim) | Live PF 1.45 vs 1-min OHLC backtest PF 4.73 | Not confirmed |
| News filter | Needs an exported news file; no effect in our tester | Not tested |
Verdict
Golden BREAK is a real, transparent gold breakout EA, and it is profitable live. Judge it by the live profit factor of about 1.45, not by the backtest. If you test it, use "Every tick based on real ticks", start with fewer strategies or lower risk to keep total exposure under control, and size the account so the minimum lot does not push risk past your limit. For a single-strategy alternative, see Gold Breakout Scalper Pro EA MT5.
FAQ
Is Golden BREAK safe for a small account?
Be careful under about 1,000 USD: the 0.01 minimum lot already risks 1.5% on the 15 USD-stop strategies, and with all seven running, total risk can reach 8–9% on one side.
Can I trust its 78% win rate?
Not from a 1-minute OHLC backtest. The live account wins 68.64% of trades.
Which timeframe should the chart use?
H1 on XAUUSD. The sub-strategies read lower and higher timeframes internally.