What is Band trend indicator?
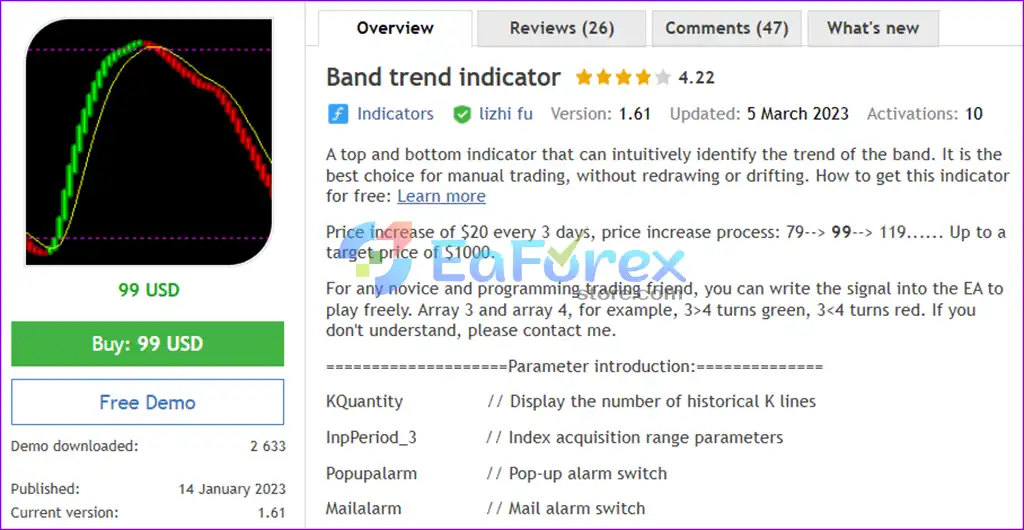
The Band Trend Indicator is a powerful tool designed to intuitively identify the trend of a financial asset's price movement. It functions as both an upper and lower indicator, offering a clear visual representation of the band’s trend. Ideal for manual trading, this indicator does not suffer from issues like redrawing or drifting, making it a reliable choice for traders seeking accuracy and consistency.
Band trend indicator Features
1. Main features:
- Top and Bottom Indicator: Visual Band Trend Indicator identifies the market trend through top and bottom lines, making it the best choice for manual trading. It ensures no redrawing or drifting, providing reliable signals.
- KQuantity Integration: Displays the number of previous K-line bars for effective trend analysis.
- Customization System: Customize the range of the indicator to adjust the sensitivity based on your trading needs.
- Pop-up Alerts: Enable or disable pop-up alerts for buy/sell signals, ensuring you never miss a trading opportunity.
- Alert Integration: Enable email alerts to stay updated on trading signals, even when you are away from your screen.
- Alert Interval: Adjust the interval between alerts to avoid over-notifications and stay focused.
2. Band trend buy and sell signals explained:
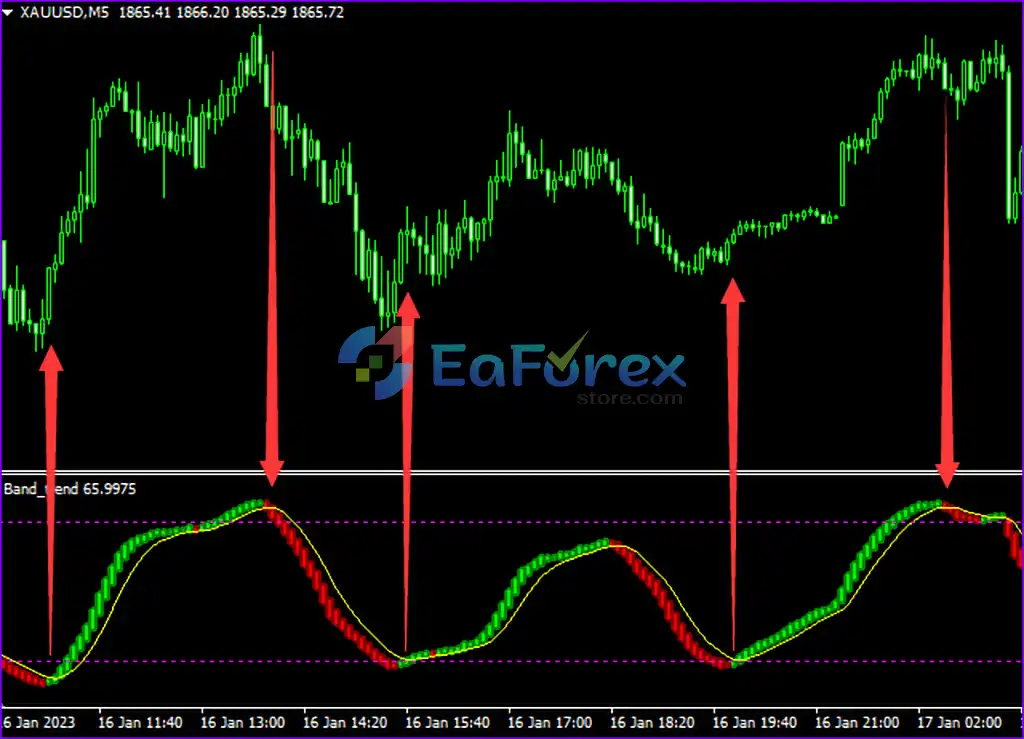
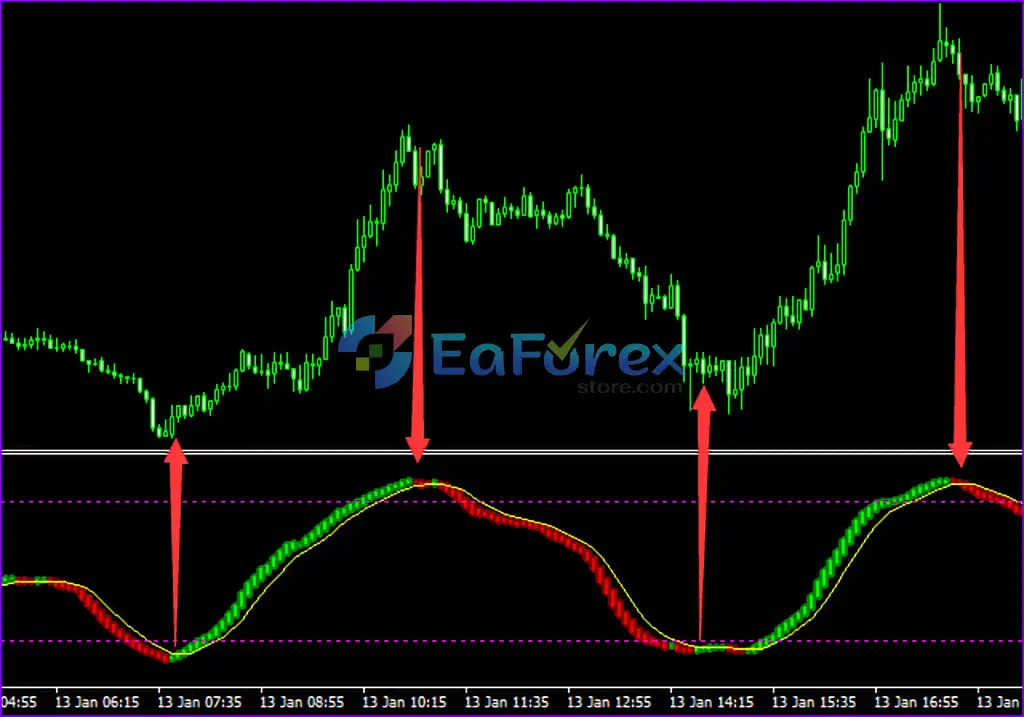
- Buy Signal: When the green bar falls below the bottom horizontal line and the red bar turns green.
- Sell Signal: When the red bar cuts the top horizontal line and the green bar turns red.
- Top Horizontal Line: Set this line to determine the resistance level in the market.
- Bottom Horizontal Line: Set this line to establish the support level for better trading decisions.
Band trend indicator Review
This setting defines the resistance level, which signals a potential area where price movements could encounter upward pressure. It also establishes the support level, indicating a key point where the price may find support and reverse direction. This balance between resistance and support plays a critical role in price action analysis, helping traders identify key levels for market entry and exit strategies.
Trading Specifications
- Trading Platform: MetaTrader 4 (MT4)
MetaTrader 4 (MT4) is a highly popular and reliable trading platform used by traders worldwide. It offers advanced charting tools, seamless execution of trades, and a wide range of features that make it an ideal choice for both beginners and experienced traders. - Time Frames: Flexible Time Frames for All Trading Styles
MT4 provides flexible time frame options, allowing traders to analyze markets and execute trades on any time scale. Whether you prefer short-term scalping, medium-term trading, or long-term strategies, MT4 can accommodate all your trading needs. - Currency Pairs: Wide Selection of Currency Pairs
MetaTrader 4 supports a broad range of currency pairs, including major, minor, and exotic pairs. This extensive selection gives traders the freedom to diversify their portfolios and capitalize on global forex market opportunities.
Latest product download package includes
The download package includes the official and latest version:
- Indicators: Band trend indicator MT4 v1.61.ex4
About the Author
This product is compiled by lizhi fu. This author has more than +10 years of experience working on MQL5 with many famous products such as Band trend indicator, TopBottomEA and other products. Among them, Band trend indicator is his best performing product in 10 years.
Conclusion
In short, The Band Trend Indicator for MT4 is a valuable tool for manual traders, offering an intuitive and reliable means to identify market trends without the issue of redraws or drifting. It functions as both an Upper and Lower Indicator, enabling traders to visually determine the band’s trend with ease. This makes it an ideal choice for those looking to streamline their trading decisions and enhance their overall trading experience.
The indicator provides key features such as customizable sensitivity, buy/sell alerts, and a straightforward signal generation system. With the ability to set specific support and resistance levels through the Upper and Lower Horizontal Lines, traders can better assess the market’s behavior and take timely action.
>>> Reviewed by Jason Stap